Most Shopify stores convert a low single-digit percentage of sessions into orders, with top performers converting at notably higher percentages. The metric to trust is Shopify’s session-based conversion rate in Shopify Analytics, not unique-visitor math from another platform. If you only fix one thing this month, audit your checkout flow and mobile page speed first: that combination drives the largest share of recoverable revenue for most stores.
TL;DR:
- The conversion rate should be measured based on sessions that complete checkout, not unique visitors, to ensure accurate benchmarking.
- Mobile traffic and paid channels typically show lower conversion rates, so segment data accordingly to identify true performance issues.
- Changes in Shopify’s session measurement, including bot filtering and attribution updates, can cause misinterpreted swings in reported conversion rates.
- Addressing common cart abandonment causes, such as unexpected costs and complicated checkout flows, can significantly recover revenue, especially on mobile.
- Prioritize fixes like improving page speed, simplifying mobile UX, and offering guest checkout before undertaking complex checkout rebuilds for rapid gains.
Table of Contents
- What conversion rate means and which formula to use
- How to calculate conversion rate in Shopify and resolve common data issues
- Benchmarks and segmenting by category, device, and traffic source
- Shopify measurement nuance: session updates, bots, and rebaselining
- Common causes of cart abandonment and low conversion
- High-impact CRO tactics for Shopify: the lever stack and sequencing
- Shopify conversion audit: a 1-day check and a week-long diagnostic
- Testing and measurement: running reliable A/B tests
- Dogtooth’s practitioner view: proof points and end-to-end measurement
- How to use benchmarks responsibly and set CRO goals
- How Dogtooth helps Shopify stores convert better
- FAQ
- Sources
What conversion rate means and which formula to use
A conversion, for an ecommerce store, usually means a completed purchase. But the word gets used loosely: some teams track add-to-cart rate, email signups, or product page views as “conversions” too. Before you benchmark anything, decide which action you are measuring, because mixing definitions makes comparisons meaningless.
Shopify defines conversion rate as sessions that completed checkout divided by total sessions, a session-based formula. That differs from the older “unique visitors” approach some analytics tools still use, where one visitor who returns three times in a week counts once instead of three separate sessions.
- Session-based rate: orders divided by sessions, the default in Shopify Analytics.
- Visitor-based rate: orders divided by unique visitors, common in older Google Analytics setups.
- Lead-based rate: form fills or email captures divided by sessions, useful for pre-purchase funnels.
The formula you choose has real implications for benchmarking. If you compare your session-based Shopify number against a visitor-based industry average, you will likely see a lower rate and assume you are underperforming when you are actually measuring something different. Stick to session-based math when you pull Shopify benchmarks, and convert other sources to the same basis before you compare.
How to calculate conversion rate in Shopify and resolve common data issues
Pull two numbers from Shopify Analytics: total sessions and orders (or “sessions that completed checkout”) for the same date range. Divide orders by sessions, then multiply by 100.
- Open Analytics, select your date range, and record total sessions.
- Record completed orders for the identical range, not a shifted or rolling window.
- Divide orders by sessions and multiply by 100 to get your percentage.
- Segment by device and channel before drawing conclusions about what to fix.
- Note any traffic spikes (ads, PR, email blasts) that could skew the denominator.
A few discrepancies trip up even experienced merchants. Multiple orders from one session happen rarely but can nudge the rate up artificially. Bot traffic inflates sessions without adding orders, which drags the rate down; Shopify’s own field documentation flags this as a known accuracy issue. Attribution differences between ad platforms and Shopify’s own reporting can also create gaps that have nothing to do with your store’s actual performance.
Pro Tip: When reconciling a conversion rate drop, check for a bot-traffic spike before you touch your checkout flow.
Statistic callout: Translating a lift into revenue is simple math. Multiply your average order value (AOV) by the number of recovered conversions. Say your AOV is $65 and a fix recovers 40 additional orders a month: that is $2,600 in monthly revenue from one change, a useful way to prioritize which fixes to build first.
Benchmarks and segmenting by category, device, and traffic source
A single “good” conversion rate number is close to useless on its own, because what counts as strong depends heavily on your category, your traffic mix, and your price point. Treat any benchmark as a starting point for comparison, not a target to chase blindly.
Published industry benchmark tables show conversion rates that vary widely by category, with beauty and personal care often converting higher than categories like luxury goods, where considered, high-ticket purchases naturally see lower completion rates per session. A store selling $25 impulse-buy items and a store selling $900 furniture should not expect the same conversion rate, even with identical traffic quality.
Segmentation matters more than the headline number. Three cuts give you the clearest read on where you actually stand:
- By category: lower-price, lower-consideration products tend to convert at higher rates than high-ticket or highly considered purchases.
- By device: mobile sessions typically convert lower than desktop, even as mobile traffic volume dominates.
- By channel: paid traffic often converts differently than organic or direct traffic, since intent varies by how a visitor arrived.
Mobile traffic now makes up the majority of sessions for most ecommerce stores, a trend documented in Statista’s data on mobile traffic share. That means your blended conversion rate is often weighed down by mobile performance, even if your desktop experience converts well. If you only look at the blended number, you can miss a mobile-specific problem that is dragging your average down.
Traffic source segmentation tells a similar story from a different angle. A store running heavy top-of-funnel paid social traffic will typically see a lower conversion rate than one relying on branded search or email, because the visitor intent is fundamentally different. Comparing your paid-traffic conversion rate against an organic-traffic benchmark, or vice versa, leads to the wrong conclusions about whether your site itself has a problem.
To pick the right benchmark cohort for your store, start with your category’s typical range, then adjust for your actual device and channel mix. Once you have identified your realistic cohort, segment your own historical data the same way (device, channel, category) so you are comparing your mobile rate to mobile benchmarks and your paid-traffic rate to paid-traffic benchmarks, not blending everything into one misleading average.
The practical takeaway: use benchmarks to flag where you are meaningfully behind a realistic peer group, not to chase an arbitrary round number pulled from a general industry average that may not reflect your traffic mix at all.
Shopify measurement nuance: session updates, bots, and rebaselining
Shopify periodically changes how it measures sessions, and those changes can shift your reported conversion rate without anything on your store actually changing. Shopify’s own documentation confirms that session measurement rollouts can change session counts and, as a result, conversion rate, and recommends merchants rebaseline rather than assume a real performance shift occurred.
A notable update, effective late September 2026, began filtering identified bots from session counts by default and adjusted how session boundaries are defined, both of which can move your baseline conversion rate up or down depending on how much bot traffic your store previously absorbed into its totals. Cookie consent settings and attribution logic add further variance: a visitor who declines tracking cookies may still complete a purchase, but their session could be undercounted or misattributed depending on your consent setup.
Before you panic over a conversion rate swing, run this checklist:
- Identify the exact rollout date for any Shopify measurement change that applies to your account.
- Compare relative order volumes (which do not change with measurement updates) against reported session counts for the same period.
- Set a new baseline conversion rate using at least two to four weeks of post-rollout data, rather than comparing directly to pre-rollout numbers.
If your order volume held steady but your conversion rate moved, the change is almost certainly a measurement artifact, not a real shift in buyer behavior.
Common causes of cart abandonment and low conversion
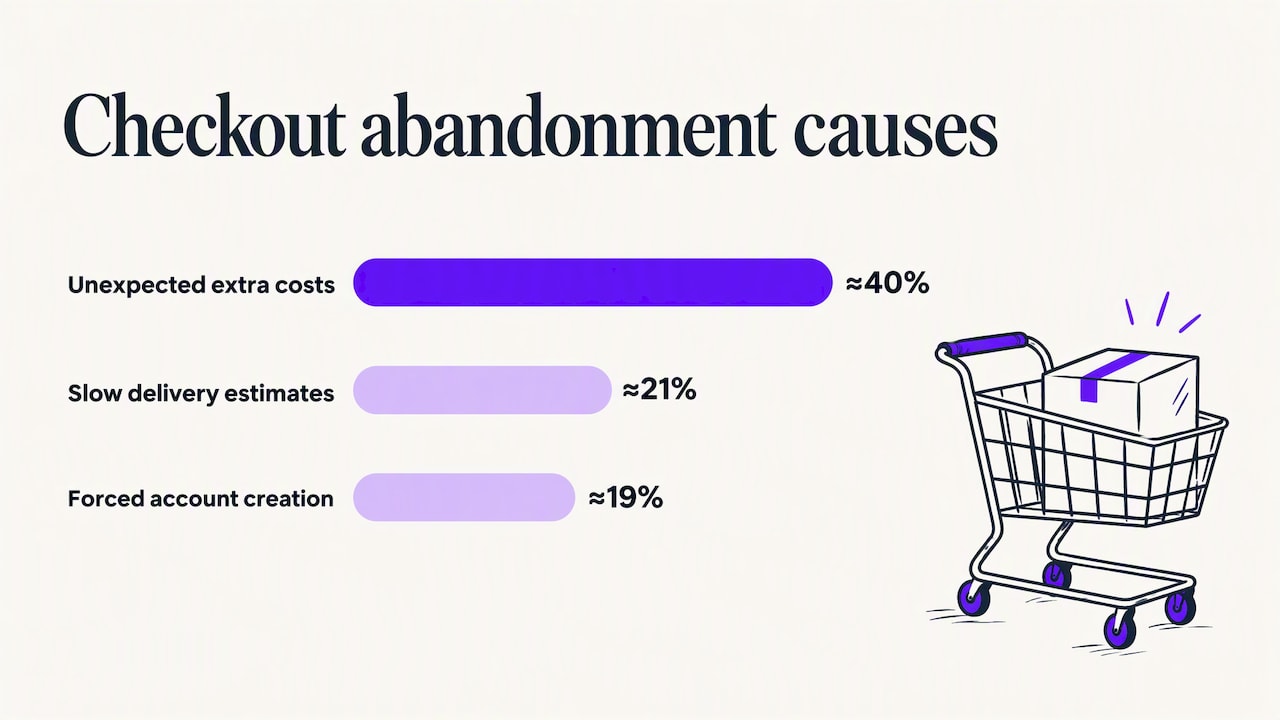
Cart and checkout abandonment are the clearest signals of where you are losing revenue, and the reasons are well documented rather than mysterious. About two-fifths of U.S. online shoppers abandon a purchase at checkout because of extra costs like shipping, taxes, or fees, according to Statista’s checkout abandonment research, making it the single largest documented cause.
The same research breaks down several other major drivers:
- Unexpected extra costs (shipping, taxes, fees) top the list at close to 40% of reported abandonment.
- Slow delivery estimates account for roughly 21% of abandonment incidents.
- Being forced to create an account before checkout drives about 19% of abandonment.
- Complicated or lengthy checkout flows add friction that compounds the above issues.
Mobile makes every one of these problems worse. A shipping cost surprise that a desktop shopper might tolerate becomes a harder stop on a small screen where re-entering payment details is more tedious, and with mobile traffic now the majority of sessions, fixing mobile-specific friction has an outsized effect on your blended conversion rate.
Each cause maps to a fairly direct fix. Surprise shipping costs point to upfront shipping calculators or free-shipping thresholds. Slow delivery estimates point to clearer, earlier delivery-date messaging. Forced account creation points to enabling guest checkout. None of these are exotic changes, but together they address the majority of documented abandonment reasons, which is why they belong at the top of any prioritization list rather than buried under more novel tactics.
High-impact CRO tactics for Shopify: the lever stack and sequencing
Not every conversion fix carries equal weight. Sequence your work so the highest-leverage changes come first, since early wins also build the case for investing in deeper, slower fixes later.
Start with page speed, because a slow site undermines every other optimization you make. Run a Lighthouse audit, then work through your theme’s unused CSS and JavaScript, compress product images, audit installed apps for ones silently loading scripts on every page, and consider server-side caching for high-traffic templates.
Mobile UX comes next, given how much of your traffic lands there:
- Simplify product pages so key information (price, shipping, reviews) appears without scrolling.
- Keep the cart icon and contents persistent and visible across the mobile browsing session.
- Reduce checkout calls-to-action to one clear next step per screen.
Checkout itself deserves focused attention, since it is where the documented abandonment reasons concentrate. Show shipping costs before the final payment screen, offer guest checkout as the default path, and support multiple payment methods including Shop Pay, which Shopify positions as a faster, higher-converting checkout option for mobile shoppers specifically.
Social proof and trust signals round out the stack: visible reviews near the add-to-cart button, a clearly stated returns policy, and recognizable security badges at checkout. These are lower-effort to implement than a checkout rebuild, which makes them a sensible first A/B test before you invest engineering time in deeper structural changes.
Pro Tip: Test trust signals and shipping transparency before you rebuild checkout flow, since both are faster to ship and give you early data on what your specific audience responds to.
Shopify conversion audit: a 1-day check and a week-long diagnostic
You do not need a consultant to find your first round of fixes. A focused one-day pass catches the most common technical issues, and a week-long diagnostic catches the behavioral ones that only show up with real traffic data.
Run these on day one:
- Pull a Lighthouse performance score for your homepage, a product page, and your cart page.
- Walk your own cart-to-checkout funnel on both desktop and mobile, noting every extra click or field.
- Confirm every payment option you intend to offer actually appears and works at checkout.
- Check image load times on your three highest-traffic product pages.
Over the following week, go deeper: segment sessions by device and channel in Shopify Analytics, review a sample of session recordings if you have a tool installed, and build a simple funnel drop-off view showing where visitors exit between product page, cart, and checkout.
Once you have identified a likely fix, the business case is simple arithmetic. Baymard Institute’s revenue-impact framework shows that recovering even a modest share of UX-driven cart abandonment can produce substantial annual revenue gains for a high-volume store, with one worked example showing a seven-figure annual increase from recovering just 10% of UX-caused abandonments.
Here is a simplified version of that math applied to a smaller store:
This is illustrative math, not a guaranteed outcome, but it shows how a modest, realistic conversion lift translates into a concrete dollar figure you can bring to a stakeholder conversation.
Testing and measurement: running reliable A/B tests
Guessing which fix worked is how teams waste months chasing changes that were never real. Shopify’s own guidance on A/B testing recommends structured testing specifically to replace that guesswork with evidence.
- Define one primary metric per test (conversion rate, not a vanity metric like page views).
- Calculate a minimum sample size before launching, based on your current conversion rate and the smallest lift you consider worth detecting.
- Run the test to a 95% confidence level before declaring a winner.
- Set guardrail metrics (AOV, refund rate) so a “win” on conversion rate is not masking a loss elsewhere.
- Roll out gradually after a win, watching guardrails for a week before full deployment.
Multivariate testing, where you test several elements at once, only makes sense once you have enough traffic to support the larger sample sizes it requires. For most small and mid-size Shopify stores, sequential A/B tests on one change at a time give cleaner, faster answers.
Statistic callout: Shopify’s guidance is explicit that proper sample sizing and a 95% confidence threshold are what separate a real result from statistical noise, a standard worth holding your own tests to even when the pressure is to call a winner early.
Dogtooth’s practitioner view: proof points and end-to-end measurement
Our work on e-commerce engineering runs on the same principle this guide follows: measure first, then fix the highest-leverage technical problem. We build and migrate Shopify platforms, integrate AI agents into checkout and support workflows, and run our own email deliverability platform.
Our deliverability platform has taken client domains from lower to higher inbox placement rates, with some clients seeing significant return on investment.
That matters for conversion work because a checkout fix means little if abandoned-cart and win-back emails never reach the inbox in the first place. We treat deliverability, site speed, and checkout UX as one connected system rather than separate projects.
How to use benchmarks responsibly and set CRO goals
Benchmarks are directional, not a scoreboard.
Prioritize revenue and margin impact over the raw percentage. A 0.3-point lift on high-AOV, high-margin traffic can outweigh a full point of improvement on discount-driven sessions. When you report CRO progress internally, tie it to a dollar figure and a margin note, not just a percentage change.
Set quarterly goals around a specific, testable fix, rather than an abstract target rate. “Reduce mobile checkout abandonment by addressing shipping-cost surprises” is a goal you can measure and act on.
— Chase
How Dogtooth helps Shopify stores convert better
Audits and benchmarks only matter if someone ships the fix. When your checkout, site speed, or email deliverability needs engineering work rather than another dashboard, we handle the build.

Our relevant work includes:
- Platform builds and migrations for stores outgrowing their current Shopify setup or moving off a legacy system.
- E-commerce engineering covering checkout optimization, speed fixes, and app audits.
- AI agents and automation that draft, check, and send abandoned-cart and win-back emails inside your existing workflow.
- MailFurnace, our deliverability platform, for stores whose conversion problem is really an inbox-placement problem.
A typical engagement starts with an audit of your current funnel and technical setup, moves into a pilot fix on the highest-leverage issue we find, and scales from there once the pilot shows measurable impact. If your Shopify store needs more than another app install, visit our services page to talk through what a technical audit would look like for your store.
FAQ
Is 2.5% a good conversion rate?
Whether it counts as “good” for your store depends on your category, price point, and traffic mix, so compare it against your own segmented benchmarks rather than a universal target.
Is Shopify still worth it in 2026?
Shopify remains a widely used ecommerce platform with active investment in analytics and checkout tools, including the recent session measurement updates covered in this guide. Whether it is worth it depends on your specific needs around customization, scale, and the technical support available to you, which is a decision best made against your own growth plans rather than a platform popularity claim.
How does Shopify calculate conversion rate?
Shopify defines conversion rate as the number of sessions that completed checkout divided by total sessions, expressed as a percentage. This session-based formula is the canonical metric inside Shopify Analytics, and it can shift after a session measurement update even without a real change in buyer behavior.
Is a 12% conversion rate on a website good?
A rate that high more often reflects a narrower conversion definition, such as email signups or a highly qualified, low-traffic segment, rather than a standard session-to-purchase rate.